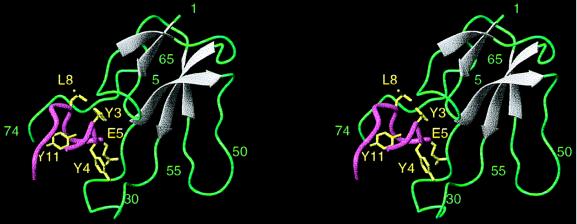
Figure 2.
Ribbon plot of the complex of α-BTX with the library-derived peptide. α-BTX residues are shown in grey (for β-sheet regions) and in green. Peptide backbone is shown in pink; side chains of peptide residues interacting with the toxin (Y3P, Y4P, E5P, L8P) as well as of Y11P which forms the hydrophobic core of the peptide, are shown in yellow. The figure was generated using the program molmol (35).

