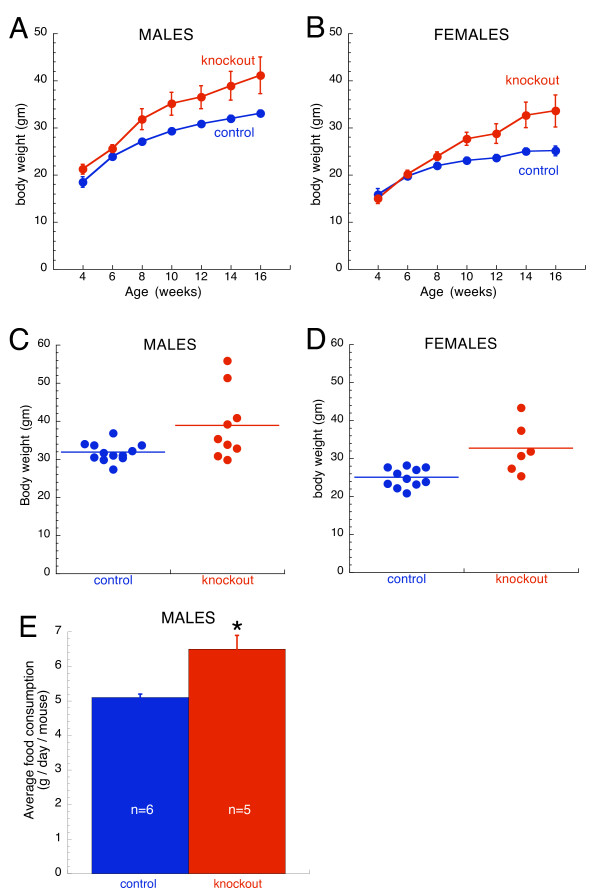
Figure 5.
Body weight and food consumption analyses of forebrain selective β3 knockouts. Growth curves of (A) male and (B) female mice (n = 4–12 mice of each gender per genotype at each age). Body weight of knockout mice was greater than controls (repeated measures ANOVA: p < 0.01 for males; p < 0.05 for females). Plotted are means ± SEM. For data points without error bars, the bars are obscured by the symbol. Body weight of individual (C) male and (D) female mice at 14 weeks of age. The horizontal line indicates the group mean. Male and female knockouts were heavier than controls (p ≤ 0.05). Note the great variability in the body weight of knockout mice, including several obviously obese male animals that are ~1.75× heavier than controls. (E) Obese forebrain selective male knockout mice consumed more food than controls (*, p < 0.05). Shown is the average daily consumption per mouse ± SEM.

