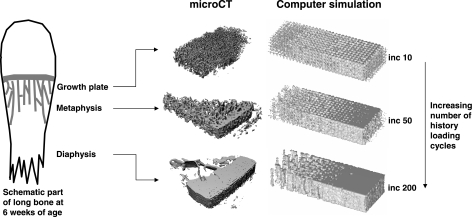
Fig. 2.
Results of µCT and computer simulations of cortical bone development. The number of history loading cycles that bone is subjected to increases from the growth plate towards the diaphysis. The left part of each picture is the endosteal side and the right part is the periosteal side. The computer simulation showed the tendency of cortical bone development. At increment 10, a trabecular structure has developed, which can be compared with the trabecular structure at growth plate level at 6 weeks of age. At increment 50, the structure corresponded with 6 weeks at metaphyseal level. At increment 200, the structure corresponded with 6 weeks at diaphyseal level.

