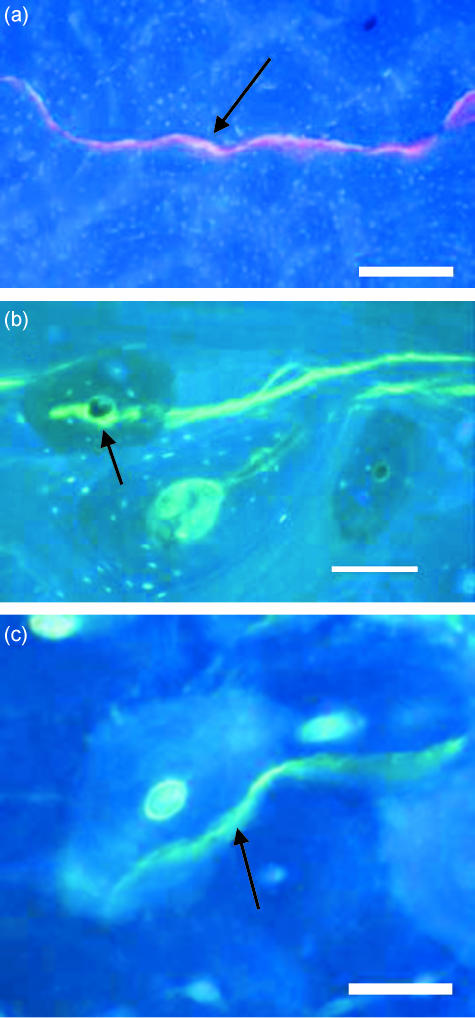
Fig. 2.
Transverse section of bone viewed with UV epifluorescence (λ = 365 nm) showing different paths taken by microcracks (black arrows) after they hit an osteon and penetrated through the cement line: (a) a microcrack (stained with xylenol orange) passes through the Haversian canals of subsequent osteons, (b) a microcrack (stained with calcein) deflected (arrow) as it hits the Haversian canal within an osteon, (c) a calcein-stained microcrack (arrow) did not hit the Haversian canal within an osteon. Scale bar, 100 µm.

