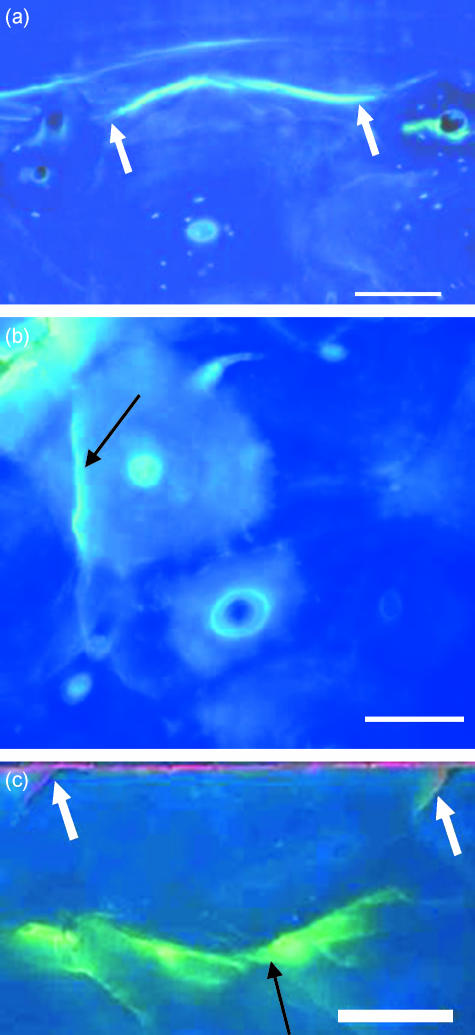
Fig. 3.
Transverse sections of bone viewed with UV epifluorescence (λ = 365 nm) showing (a) a microcrack stained with calcein limited by osteons at both ends as shown by arrows, (b) microcrack that lies totally within an osteon (arrow), (c) alizarin (fluorescing red) has labelled the outer surface of the specimen. Pre-existing microcracks are shown (white arrows). Calcein-labelled microcrack (black arrow) that did not hit any osteon is also visible. Scale bar, 100 µm.

