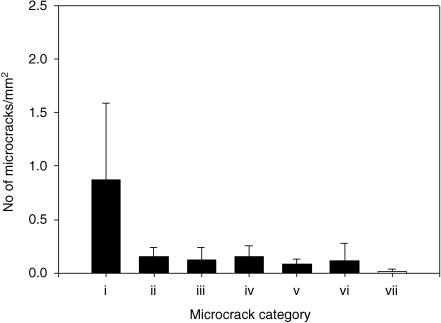
Fig. 5.
Crack numerical densities for all type of microcracks. (i) Did not hit an osteon. (ii) Hit an osteon and were halted. (iii) Hit an osteon and were deflected. (iv) Hit an osteon and penetrated the cement line. (v) Hit an osteon at both ends. (vi) Osteonal. (vii) Pre-existing. Error bars represent standard deviation. Kruskal–Wallis one-way analysis of variance on ranks showed that the number of microcracks that did not hit any osteons was highest, P < 0.05.

