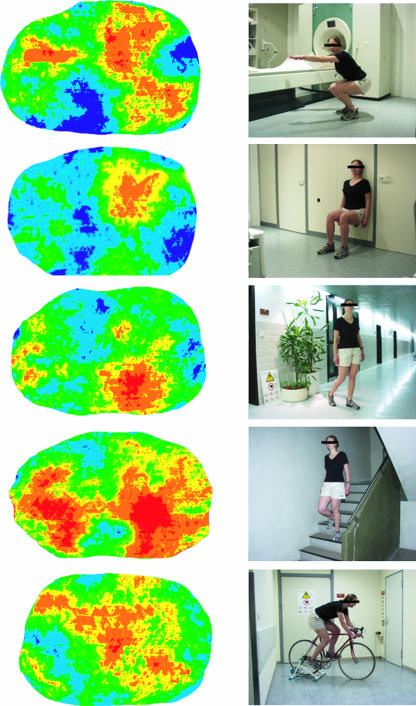
Fig. 6.
In vivo deformation patterns of patellar cartilage after different physiological activities (see text). A posterior view onto the right patellar cartilage surface (proximal pole of the patella on top, medial side on the left): average of differences in cartilage thickness before and after various activities averaged over 12 volunteers. Red and orange colours show areas of high deformation, blue colour areas of little deformation.

