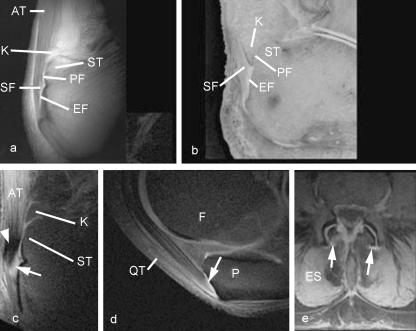
Fig. 4. MR images of entheses.
(a) A UTE image and (b) a corresponding methacrylate section of the Achilles tendon (AT) enthesis, cut in the mid-sagittal plane to show the periosteal (PF), sesamoid (SF) and enthesis (EF) fibrocartilages, which can be identified in the UTE sequence. K, Kager's fat pad; ST, superior tuberosity. Panel b is reproduced with permission from Robson et al. Clin Radiol 2004, 59, 729. (c) A sagittal magic angle image of the Achilles tendon enthesis. Low signal is seen in the tendon posterior to the calcaneus (arrowhead), but high signal is seen in the sesamoid fibrocartilage (arrow). (d) Sagittal magic angle image of the quadriceps tendon (QT) insertion on the patella (P). The enthesis fibrocartilage (arrow) has a high signal. F, femur.
(e) Tranverse UTE image of the lumbar spine in a patient with degenerative spine disease. High signal is seen in the region of the dorsal capsule of the lumbar facet joints (arrows). ES, erector spinae.

