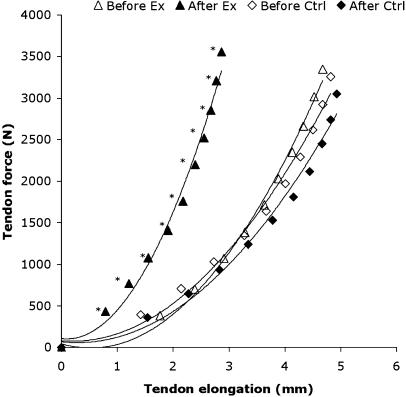
Fig. 6.
The patellar tendon force–elongation curves for the resistance exercise group (Ex, n = 9) and a non-exercising control group (Ctrl, n = 9). Values are means; an asterisk denotes reduced elongation after resistive exercise training (P < 0.01). (From Reeves et al. 2003).

