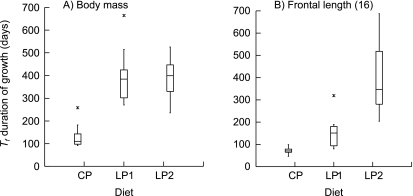
Fig. 7.
Box plots of estimated growth duration (Tf) for (A) body mass, and (B) frontal bone length. Average body mass mean corrected R2 of CP group = 0.983, LP1 group = 0.996, LP2 group = 0.995. Average frontal bone length mean corrected R2 of CP group = 0.907, LP1 group = 0.855, LP2 group = 0.801. Numbers in parentheses correspond to measurement numbers in Fig. 1 and Table 3.

