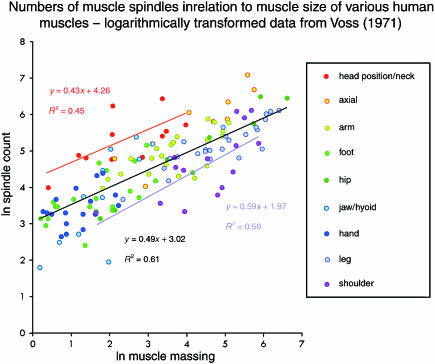
Fig. 2.
Scatter plots of logarithmically transformed spindle counts against muscle mass for the complete sample of human muscles. The least-squares regressions of ln (spindle number) vs. ln (mass) are shown together with their respective equations, as follows: total sample in black; head position and neck muscles in red; shoulder muscles in purple.

