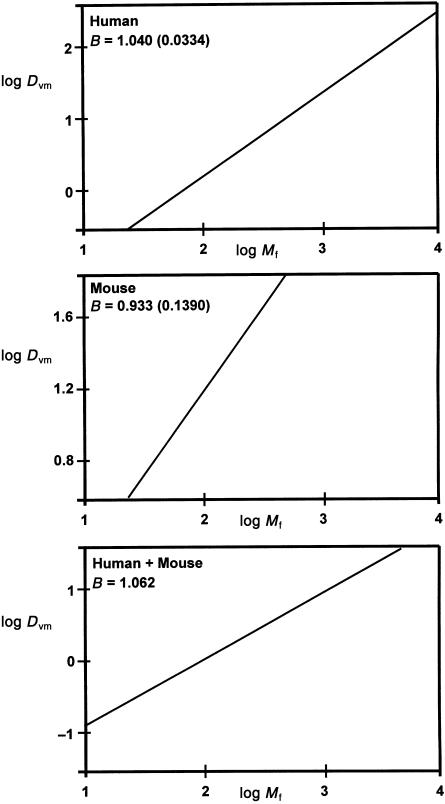
Fig. 1.
Allometric relationships between villous membrane diffusive conductances and fetal mass. Graphs show log–log plots and the exponent B (SEM) for diffusive conductance (Dvm) relative to fetal mass (Mf) within and across species. Upper graph: relationship for human placentas (Mf in g; based on present data). Middle graph: relationship for murine placentas (Mf in mg; based on data in Coan et al. 2004). Bottom graph: relationship across both species (Mf in g; based on both studies).

