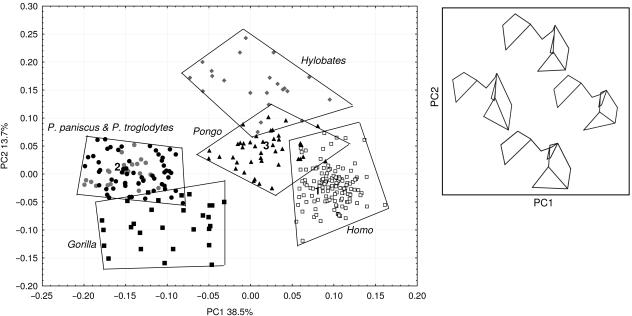
Fig 3.
PCA scatterplot of all hominoids for PC1 and PC2. Numbers 1–3 correspond to shapes in TPSA; see Fig. 4. The box depicts wireframe diagrams (posterior view) that correspond to landmark configurations in the PCA scatterplot. Left wireframe, low PC1; right wireframe high PC1. Top wireframe, high PC2; bottom wireframe, low PC2.

