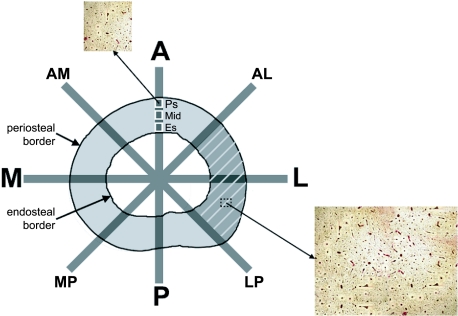
Fig 1.
Femoral cross-section designating the anatomical axes and axes at 45° to the anatomical axes, thus dividing each cross-section into octants. Moments of inertia were calculated about each axis and section modulus was calculated about the mediolateral axis. Periosteal area is inside the periosteal border, endosteal area is inside the endosteal border, and cortical area is between the two borders. Cortical thickness is the average perpendicular distance between the periosteal and endosteal borders. Porosity was quantified by anatomical quadrant (e.g. shaded area for lateral quadrant), as well as for the entire cross-section. Porosity was also quantified at three radial locations (designated by white squares: Ps, periosteal; Mid, midcortical; Es, endosteal) along each octant line. The inset images show basic fuchsin-stained sections of bone at 40× magnification that were used to calculate porosity digitally.

