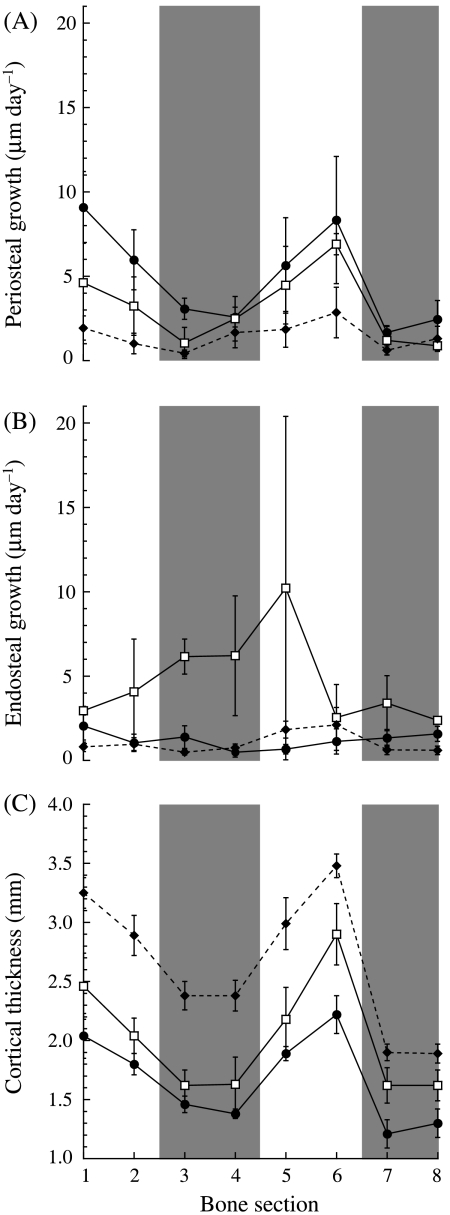
Fig. 2.
(A) Periosteal growth rates, (B) endosteal growth rates and (C) cortical thickness vs. bone section for the three age groups. Numbers 1–8 on the x-axis refer to the numbered bone subsections in Fig. 1. Each point represents the mean ± SE. Sample sizes for each group are given in Table 2. The following symbols represent each group: small (•), intermediate (□) and adult (♦). The shaded bars indicate the cranial (subsections 3 and 4) and caudal (subsections 7 and 8) regions of the bone. As in Table 2, because N = 2 for the intermediate group, the error bars simply represent the difference between each of the two data points and the mean.

