Fig. 3.
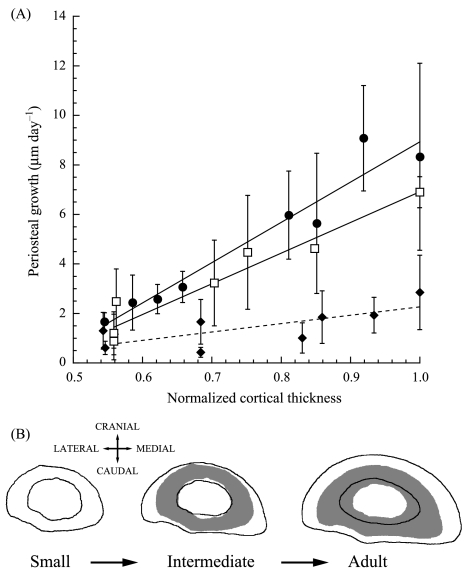
(A) Periosteal growth rate vs. cortical thickness normalized by the thickest cortical region. Each point represents the mean ± SE. The following symbols represent each group: small (•), intermediate (□) and adult (♦). Each line is the least-squares regression fit to the data for each age group. Small: y = −7.3 + 16.3x (± 4.2, ± 95% CI, R2= 0.94), intermediate: y = −5.5 + 12.4x (± 3.3, R2= 0.93), adult: y = −1.1 + 3.4x(± 3.1, R2= 0.55). Sample sizes are given in Table 2. As in Table 2, because n = 2 for the intermediate group, the error bars simply represent the difference between each of the two data points and the mean. (B) Sample radius cross-sections for each age group illustrating the changes in cross-sectional geometry with growth. The grey shadows in the intermediate and adult bones are the cross-sections from the small and intermediate groups, respectively, to emphasize the changes with age/size. Each bone cross-section is a representative of each group, but the cortical thicknesses and changes in endosteal and periosteal diameters from one group to the next do not directly correspond to the means presented in Fig. 2 or Table 2. The ulna has been omitted for clarity.

