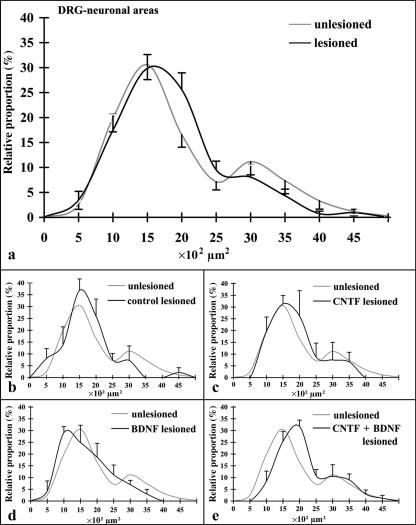
Fig. 4.
Histograms of relative proportions of sensory neuron cell body areas in all unlesioned and lesioned DRGs (a; means ± SEM) and of neurons in lesioned DRGs (black lines; means ± SEM) of controls (b), CNTF-treated (c), BDNF-treated (d), and CNTF + BDNF-treated animals (e). Light grey lines in (b)–(e): histogram derived from all unlesioned DRGs (means only; cf. a).

