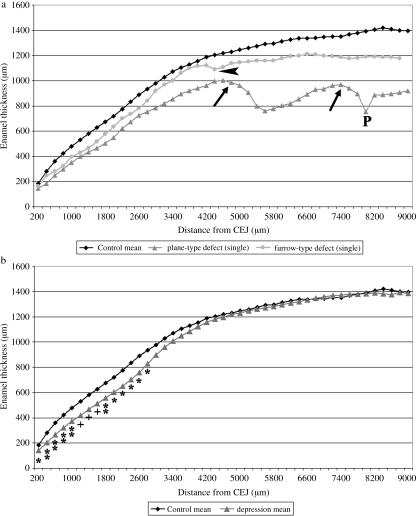
Fig. 9.
Results of enamel thickness measurements. (a) Comparison of lingual enamel thickness in control M2 (mean of eight specimens, upper curve), in a single M2 exhibiting a furrow-type defect (LEH, middle curve) and in another M2 showing two plane-type hypoplastic defects (lower curve). Note grossly reduced thickness of cuspal enamel in the tooth exhibiting the two plane-type defects. Ledges located cervical to these defects are marked by black arrows. The two defects are shown in Figs 1(a) and 5(a). P = pit-type defect located in ledge area. In the tooth exhibiting LEH, the arrowhead indicates the furrow marked by ‘L’ in Fig. 6(c). (b) Comparison of enamel thickness between control M2 (n = 8) and M2 (n = 7) classified as exhibiting depression-type defects. Significant differences of enamel thickness at corresponding distances from the CEJ are marked (*P < 0.05, **P < 0.01, Student's t-test; +P < 0.05, Mann–Whitney U-test).

