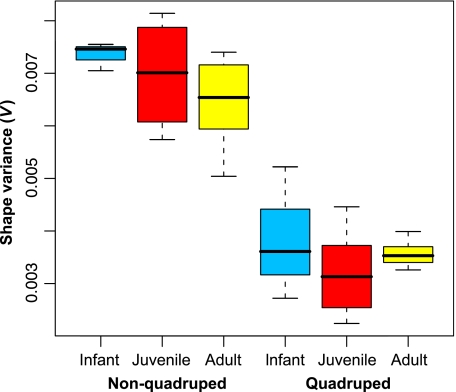
Fig. 4.
Boxplot showing the distribution of shape variance when species are combined into two groups comprised of non-quadrupeds (QI < 0.25: Ateles, Hylobates, Gorilla, Lagothrix, Pan paniscus, Pan troglodytes, Pongo and Symphalangus) and quadrupeds (QI > 0.50: Alouatta, Cercocebus, Cercopithecus, Colobus, Macaca, Nasalis, Papio, Presbytis and Saimiri) for three ontogenetic stages (infant = m1, juvenile = m2, and adult = m3). All shape variances were calculated from Procrustes data standardized by centroid size to minimize overestimates due to ontogenetic size heterogeneity. Shape variance is higher in non-quadrupeds in all ontogenetic stages.

