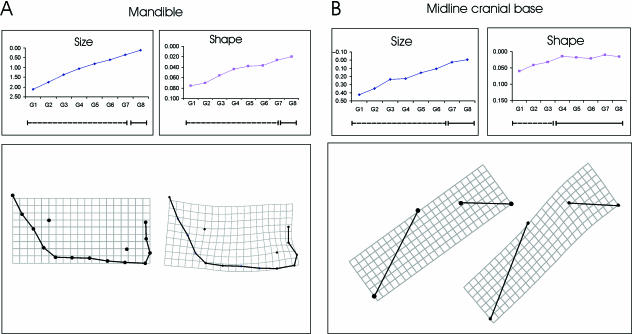
Fig. 4.
Maturation patterns of (A) the mandible and (B) the midline cranial base. The differences in size and shape between the subadults and the adults are given. In the inset graphs centroid size and shape (Procrustes) distances to adults are plotted. The significances of the differences in size and shape between the subadults and adults are shown on the bars beneath these graphs in which dashed lines indicate significant differences from adult. These indicate the immature portions of the ontogenetic trajectories, solid lines the mature ones (absence of significant differences). The reference and transformation grids for the relevant landmark configurations are shown beneath each graph. Note the ontogenetic dissociation in the midline cranial base between the achievement of adult size (by G7) and adult shape (by G4).

