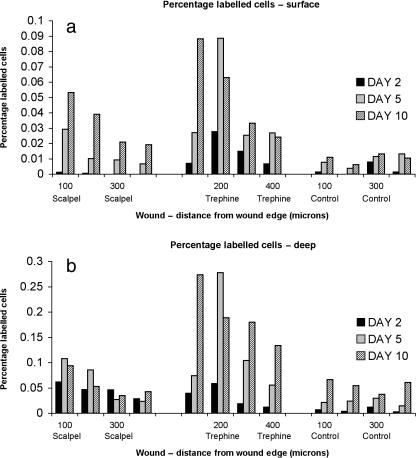
Fig. 4.
Histograms showing the mean (n = 36) percentage of 3H-thymidine-labelled cells 0–100 µm, 101–200 µm, 201–300 µm and 301–400 µm from the wound edge in scalpel-wounded, trephine-wounded and unwounded control tissue at days 2, 5 and 10 post-wounding within the surface zone (a) and deep zone (b) regions.

