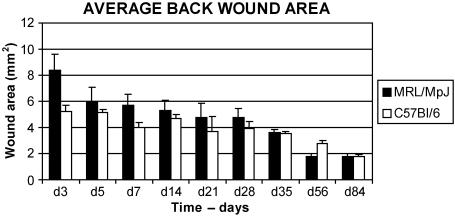
Fig. 6.
Graph of collated wound surface areas. Total wound areas were calculated using data collected from the evenly spaced wound sections. Note that the MRL/MpJ wounds are slightly larger than the C57BL/6 wounds at the early time points, although not significantly so (P > 0.05). Also note that the day 84 wound areas are the same in both groups, indicative of similar sized scars, n = 3.

