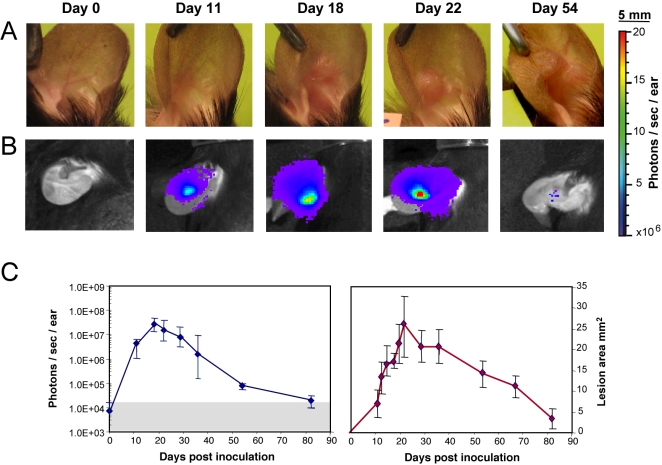
Figure 1. In vivo bioluminescence imaging of Leishmania in the C57BL/6 ear model.
Simultaneous follow up of parasite load in the ear dermis and of lesion onset, features and cure in mice inoculated with luciferase-transgenic Leishmania major. 104 luciferase-expressing NIH 173 metacyclic promastigotes were inoculated into the dermis of the right ear of C57BL/6 mice (day 0) and followed for more than 80 days. The bioluminescent signal is displayed as a pseudo-colour image representing light intensities over the body surface area. Red represents the most intense signal while blue corresponds to the weakest one. A, B: Individual follow up of a representative mouse left without any ointment application. Clinical features (A) were simultaneously monitored with parasite load fluctuations assessed by the bioluminescence of luciferase-expressing parasites (B). (C) Bioluminescence quantification of the parasite load (left panel; photons/sec/ear; grey area = background measurement) and “lesion” area (right panel; mm2) were followed for 7 mice left without any ointment and depicted as medians +/−sd. Note the detection of a bioluminescence signal before any significant clinically detectable features. Of note, the so called “lesion” area measured between day 11 and day 15 was still made up of inflammatory processes free of any leukocyte infiltrates.

