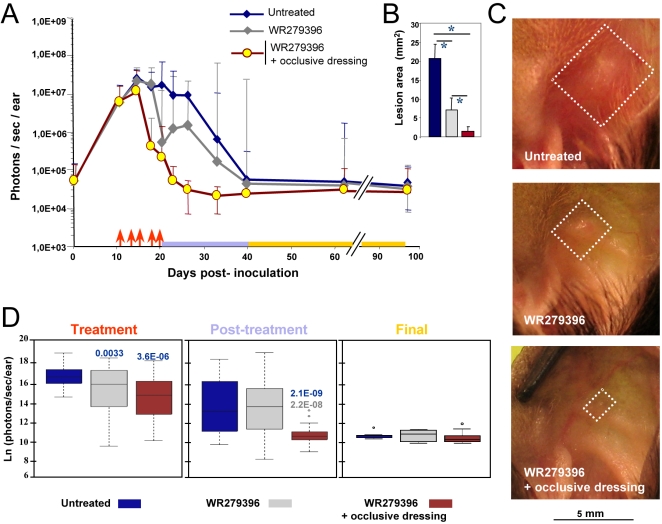
Figure 3. Earlier and sustained control of both parasite load and lesion healing post topical applications of WR 279396.
104 luciferase-expressing L. major metacyclic promastigotes were inoculated into the dermis of the right ear of C57BL/6 mice (day 0) and mice were followed for 3 months. We compared parasite load and clinical feature outcome in mice left without any ointment (group 1, blue line) or receiving the WR279396 ointment (one application ( ↑ ) every two days, over ten days either without dressing (group 2, grey line) or with an occlusive dressing (group 3, brown line) at 11 day post-inoculation of promastigotes. Total photon emission from the L. major-loaded site (A, photons/sec/ear) is depicted as medians ±sd. Lesion area (B; mm2) and representative pictures of C57BL/6 L. major loaded-ears (C), at day 28 post-inoculation, are presented. Significant differences are indicated as follows: * for P<0.001. White squares delimit the “lesion” area of groups 1, 2 and 3 respectively. The three periods of observation (treatment, post-treatment and final) are represented by a colour code. (D) Comparison of bioluminescence (natural logarithm (ln) of photons/sec/ear) for each group of mice during the period of observation. The box plot for each group, assessed by a two-way ANOVA, graphs the percentile and median of parasite loads. The ends of the box define the 25th and 75th percentiles, with a line at the median and errors bars defining the 10th and 90th percentiles. The dots outside the ends of the whiskers are outliers. The p-values are displayed on the top of each box with the following colour code: -blue indicates that the group under study is compared to the blue group-grey indicates that the group under study is compared to the grey group.

