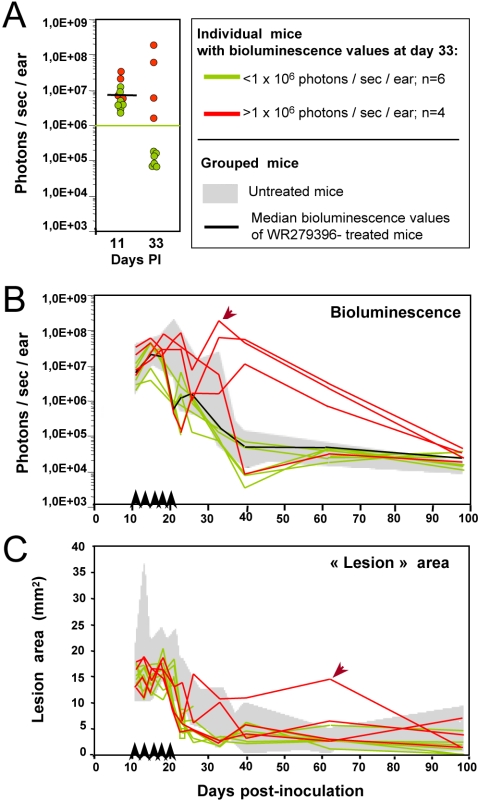
Figure 4. Individual follow up of bioluminescence (parasite load) and “lesion” area in mice treated with WR279396 without any dressing.
104 luciferase-expressing L. major metacyclic promastigotes were inoculated into the dermis of the right ear of C57BL/6 mice (n = 10; day 0) treated with WR279396 (5 applications (↑) for 10 days) at day 11 post-inoculation. The parasite load (photons/sec/ear) in individual mice (A, B) and the area (mm2; C) of the lesion displayed by the same mice were followed for 3 months. (A, B, C) Green colour assesses the profile in mice that controlled their ear parasite load, i.e. exhibiting a bioluminescence value<1×10⁶ photons/sec/ear at day 33 (green points in panel A and green lines in panels B and C). In contrast, red colour corresponds to mouse ears that display a high bioluminescence value at day 33 (>1×10⁶ photons/sec/ear; red points in panel A and red lines in panels B and C). Note that lesion area values (C) did not assess any clinical failure except in 1 mouse (arrow). Values obtained for control mice are shown in the grey areas indicated in each graph.

