
Figure 1.
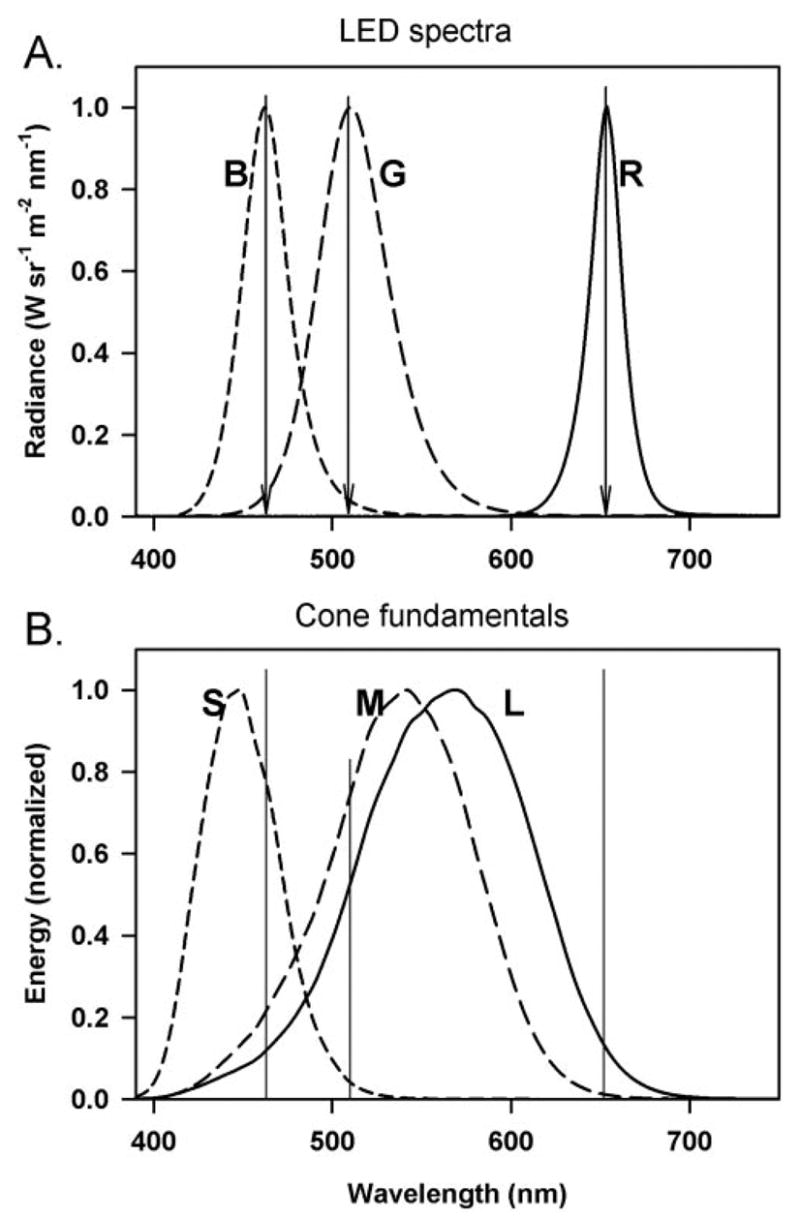
(A) Spectrum of the three LEDs (blue, green, and red) of the stimulator (Espion ColorBurst, Diagnosys LLC, Lowell, MA). (B) Cone fundamentals of the three human cones (S, M, and L) for a 10° field (from Stockman et al.25). The vertical lines in (B) correspond to the peak wavelength of the LEDs denoted by arrows in (A).