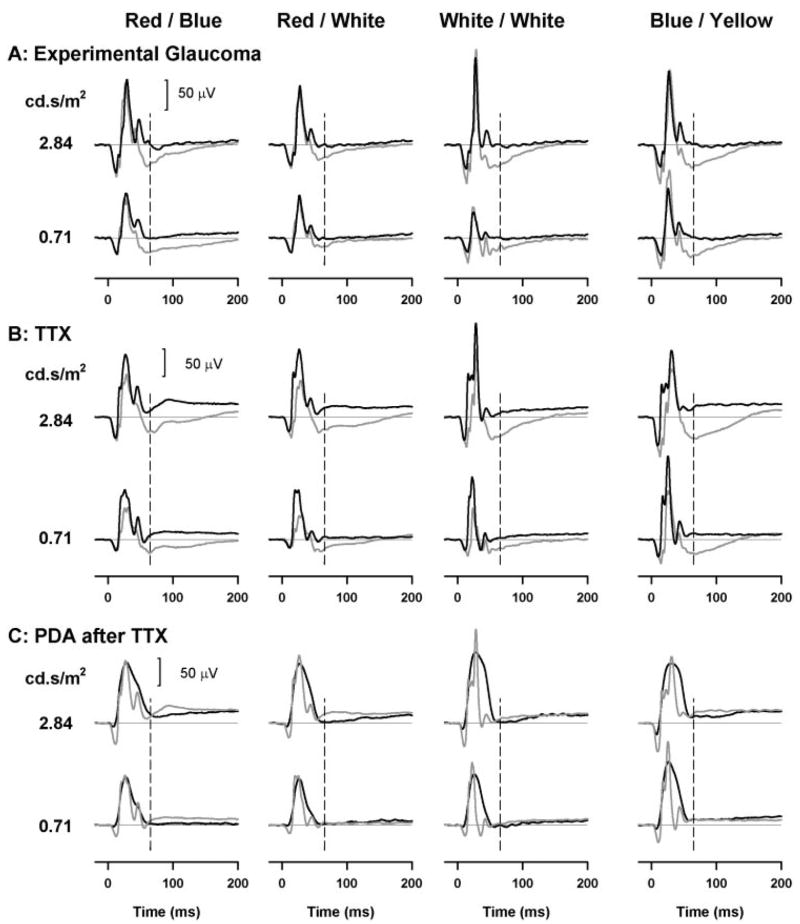
Figure 4.
Photopic full-field flash ERGs with brief flashes obtained before (gray trace) and after experimental glaucoma (black trace) (A), TTX (black traces) (B), and PDA after TTX (black traces). The ERGs after TTX are shown as a solid gray line (C) for two stimulus energies (0.71 and 2.84 cd-s/m2).

