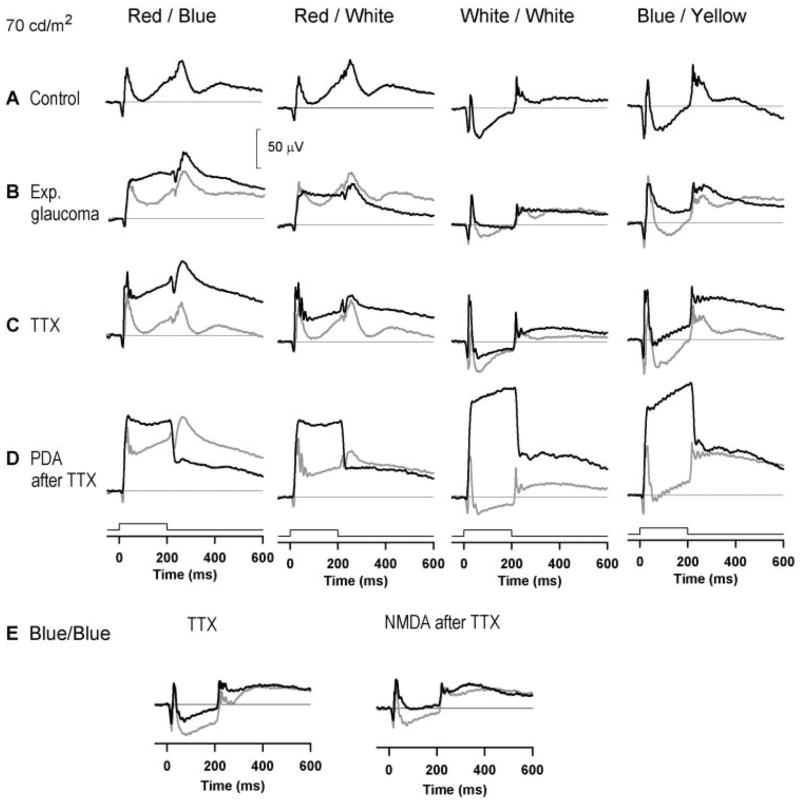
Figure 6.
Photopic full-field flash ERGs obtained with long-duration (200 ms) flashes for the different colors shown for a stimulus luminance of 70 cd/m2 from a control monkey eye (black line) (A); experimental glaucoma (black line; control is shown by the gray line) (B); TTX (black line) (C); and PDA after TTX (black line). The ERGs after TTX are shown by the gray line (D); the effect of TTX (left, 1.1 μM; black line) and NMDA (1.6 mM) after TTX on a long-duration flash response recorded with a blue flash on a blue background for the same flash and background luminance as used in (A–D). The preinjection control response (left) and the ERG after TTX but before NMDA (right) are shown by the gray lines (E).

