
Figure 7.
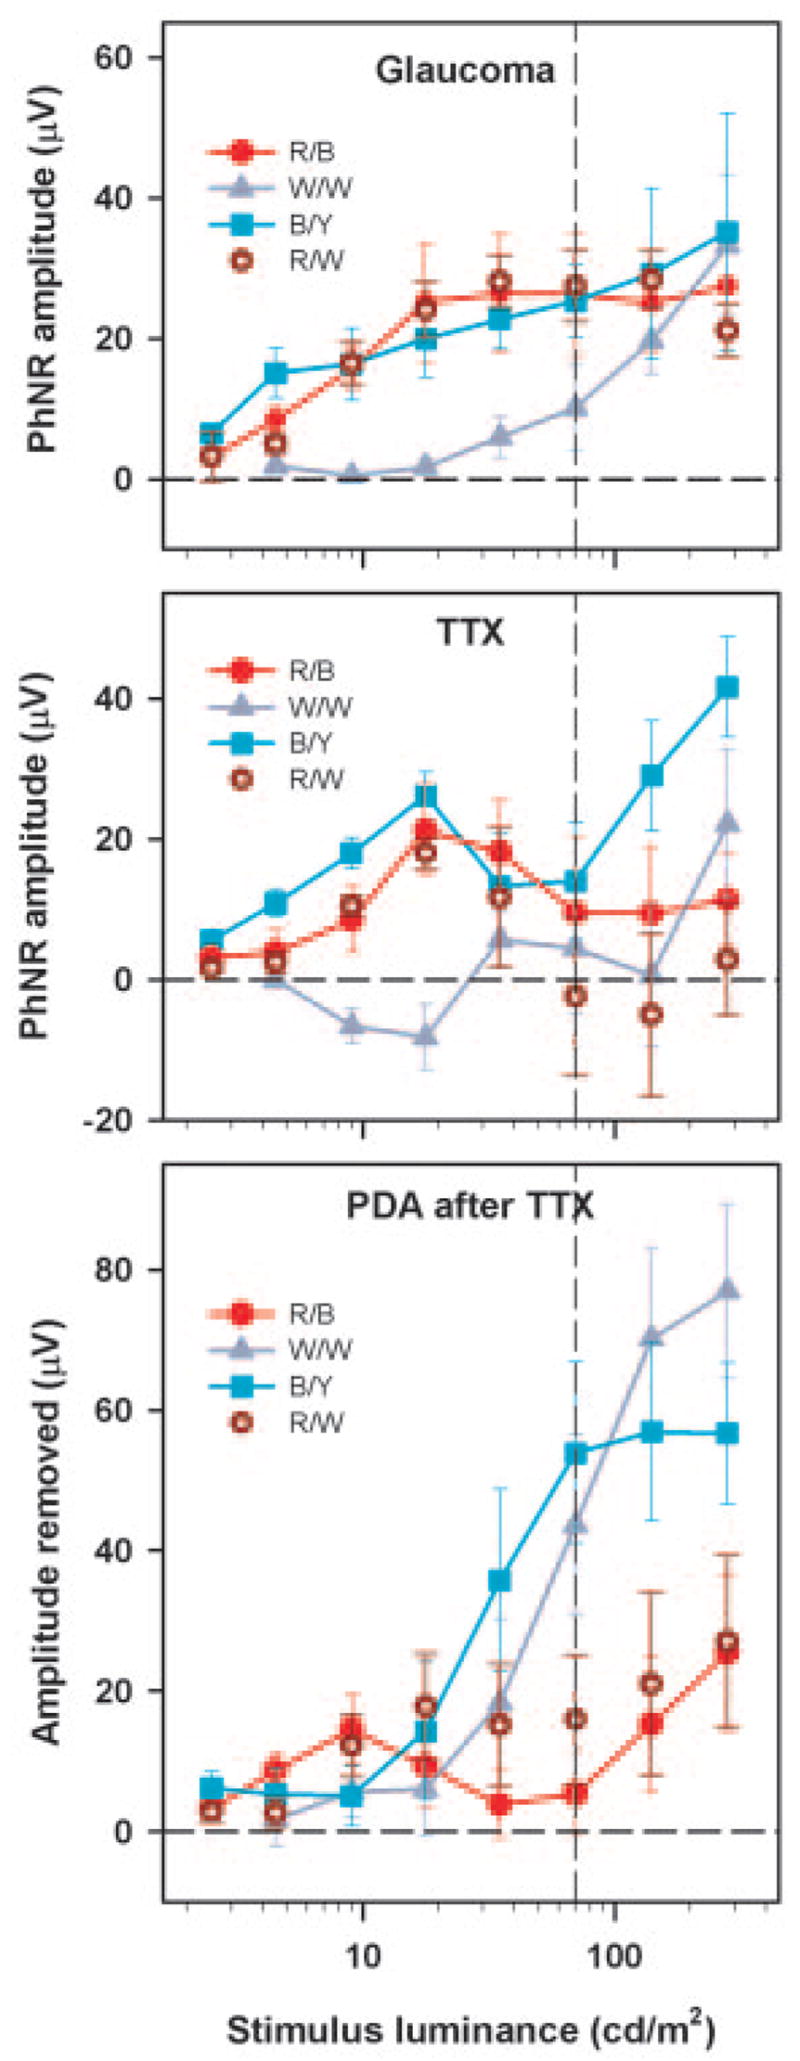
Top: experimental glaucoma (n = 6). Middle: TTX-sensitive PhNRon (n = 3) plotted as a function of the stimulus luminance for the different color combinations. Bottom: PDA (after TTX; n = 3)-sensitive portion of the On part of the long-duration flash ERG as a function of stimulus luminance for the different color combinations. Error bars: ±1 SEM. The vertical dashed line in these plots represents the stimulus luminance for which ERGs are shown in Figures 6 and 8.