
Figure 4.
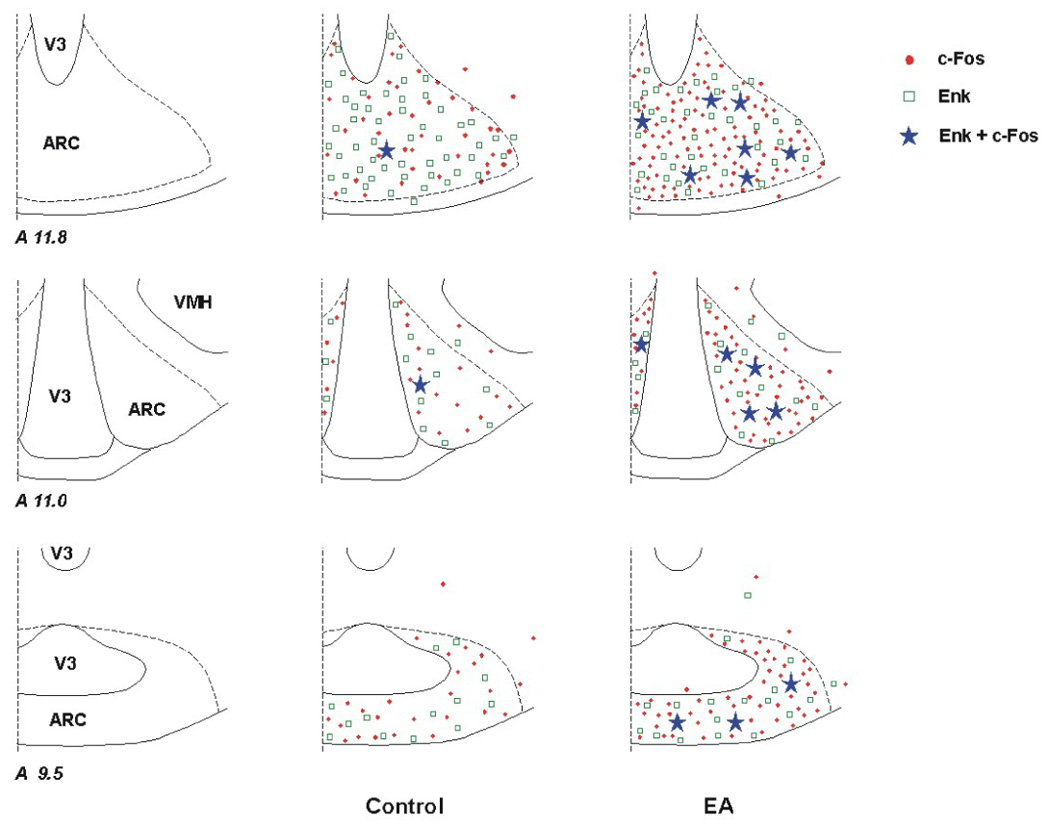
Distribution of enkephalin (Enk) labeled cells and c-Fos reactivity in the arcuate nucleus (ARC) of a control animal and a cat subjected to electroacupuncture (EA). Three coronal sections (Berman’s atlas) were selected from each animal. Each symbol, ●, □, or ★ represents one labeled cell with c-Fos, enkephalin or c-Fos + enkephalin, respectively.