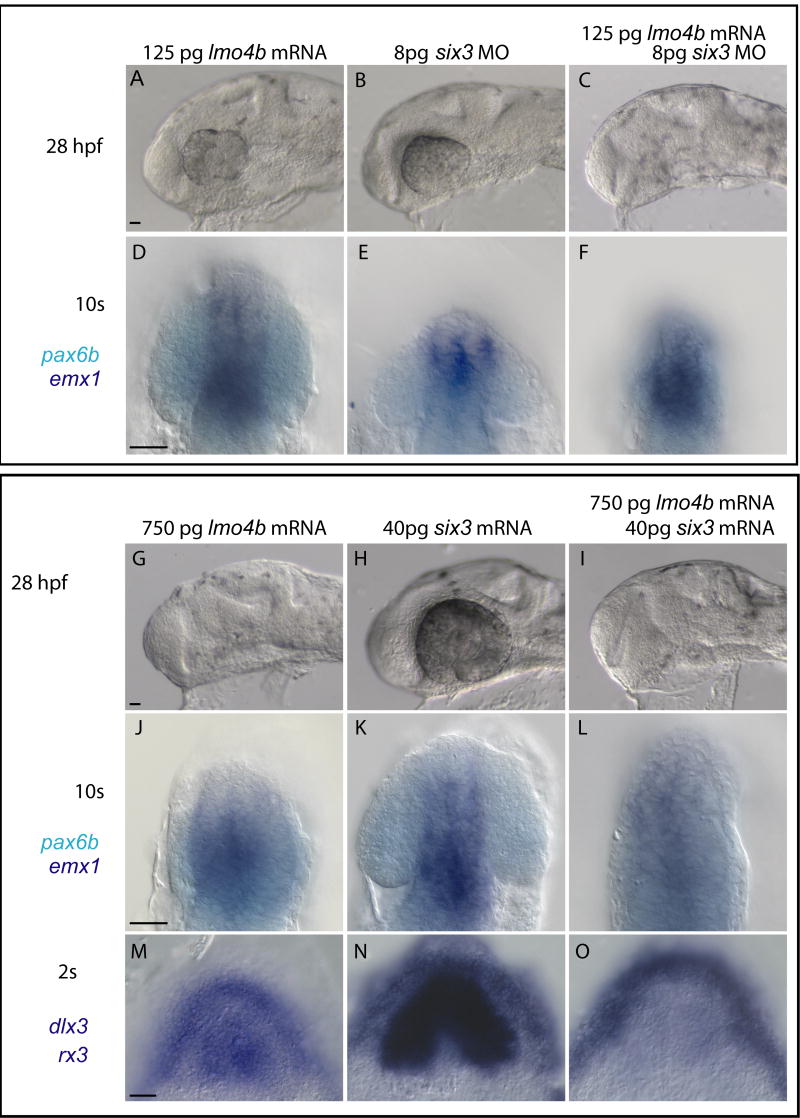
Figure 8. lmo4b overexpression modifies six3 gain and loss of function phenotypes.
Embryos injected with lmo4b mRNA and six3 MO (A–F) or six3b mRNA (G–O) as indicated in each panel, and stained by in situ hybridization as indicated in far left column. A–L are lateral views, D–F and J–L are enlarged views in a more superficial focal plane of the embryos in A–D and G–I, respectively. M–O are dorsal views of the anterior neural plate. Scale bar in all panels is 20μ.

