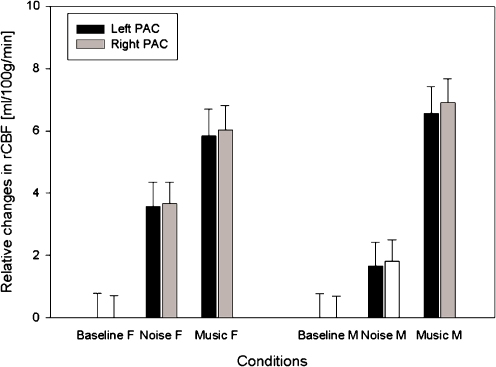
Fig. 2.
Regional cerebral blood flow relative to the baseline of each group, based on all voxels in the left and right PAC (with a global mean flow of 50 ml/100 g/min). Error bars indicate the 90% confidence interval of the mean across subjects per condition; the confidence interval of the baseline is also given

