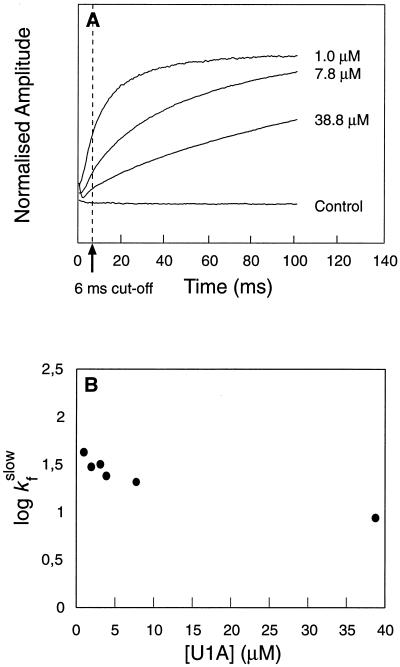
Figure 2.
(A) Time course for refolding of U1A at different protein concentrations. Final [Gdn⋅HCl] = 0.46 M. At moderate to high protein concentrations (>5 μM), the time course is dominated by the slow phase, but at low protein concentrations folding occurs mainly by the fast reaction. (B) The rate constant of the slow phase decreases slightly with increasing protein concentration, whereas the fast reaction appears independent of protein concentration. The negative concentration dependence of the slow phase is inconsistent with formation of aggregates, since this process would become faster at high protein concentrations. Hence, it is likely that the slow phase represents a dissociation process—i.e., folding from an aggregate. Data from the first 6 ms were excluded from the fits. Control experiments were conducted with free tryptophan and with U1A contained in the dilution buffer.

