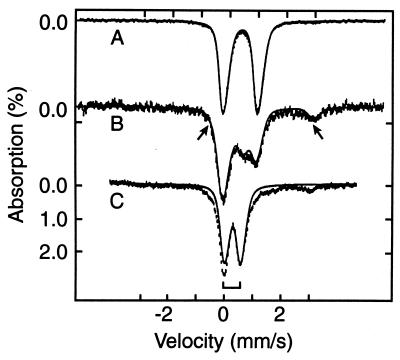
Figure 1.
The 4.2 K Mössbauer spectra of anaerobically isolated FNR (A), and FNR exposed to oxygen for 2 min (B) and 17 min (C). The solid line in A is a doublet for [4Fe-4S]2+ simulated with ΔEQ = 1.22 mm/s and δ = 0.45 mm/s. The solid line in C is a simulated spectrum using one doublet with ΔEQ = 0.58 mm/s and δ = 0.28 mm/s for the [2Fe-2S]2+ cluster (bracket). The solid line drawn through the data in B is a superposition of the theoretical curves for the [4Fe-4S]2+ cluster and the [2Fe-2S]2+ cluster, plus a contribution (arrows) from the Fe2+ component. The relative proportions of the various species are listed in Table 1.

