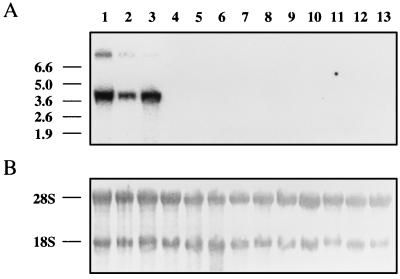
Figure 3.
Northern blots of GlcAT-P mRNA. (A) Autoradiograms of blots probed with the GlcAT-P cDNA. Two GlcAT-P mRNAs were specifically expressed in rat cerebral cortex (lane 1), cerebellum (lane 2), and whole brain (lane 3). No signals were detected in the lung (lane 4), liver (lane 5), kidney (lane 6), ileum (lane 7), testis (lane 8), lymphoid nodule (lane 9), thymus (lane 10), spleen (lane 11), heart (lane 12), and macrophage (lane 13). The positions of maker RNAs are indicated on the left. (B) The same blots were stained with methylene blue. The positions of ribosomal RNA are indicated on the left. An aliquot (10 μg) of total RNA was applied to each lane.

