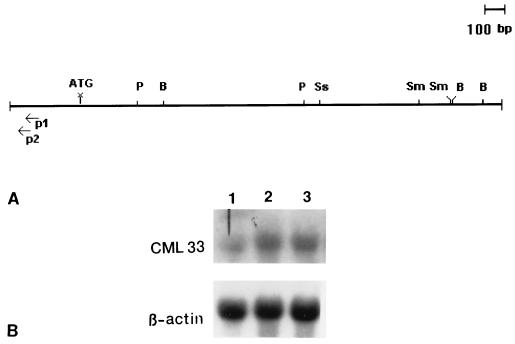
Figure 1.
(A) Restriction map of the CML33 cDNA. The full-length cDNA sequence was assembled from three individual overlapping clones isolated. Position of the initiation codon ATG is indicated. P1 and P2 show the positions of the two primers used to identify the 5′ end of the transcript by RACE. Vertical bars represent the restriction enzyme sites (P, PstI; B, BglI; Ss, SstI; Sm, SmaI). (B) Expression of CML33 mRNA in peripheral blood lymphocytes (lane 1) and bone marrow mononuclear cells (lanes 2 and 3) of two normal healthy individuals. Lanes 1 and 2 are samples derived from the same individual. Note higher steady-state level of the CML33 transcript in the bone marrow cells. The same blot was hybridized with a β-actin probe to estimate the amount of RNA loaded in each lane.

