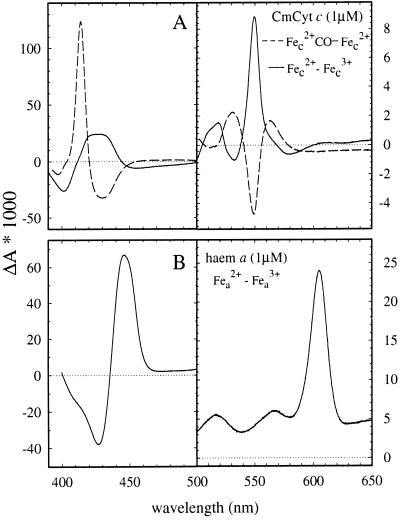
Figure 1.
Absorption difference spectra of (A) CmCyt c; ferro minus ferri (solid line) and carboxy-ferro minus ferro (dashed line). (B) Heme a of cytochrome c oxidase measured as the difference between reduced and fully oxidized enzyme with cyanide bound to Fea3 (CuB).The spectra were recorded with 6.3 μM and 2.4 μM for CmCyt c and cytochrome c oxidase, respectively, but in the figure they are scaled to a 1 μM concentration. Note the different absorbance scales in the right and left panels. Conditions: 10 mM Hepes, pH 7.1, 22 ± 1°C.

