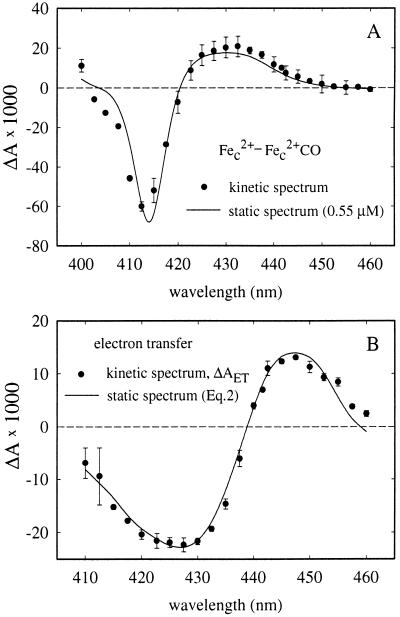
Figure 4.
(A) Kinetic difference spectrum of the initial rapid absorbance changes following immediately after the flash (•) (see Fig. 3). The solid line is the difference spectrum of ferro- minus carboxy-ferro-CmCyt c (cf. Fig. 1A), scaled to a concentration of 0.55 μM. (B) Kinetic difference spectrum of the 9,700 s−1 absorbance changes (•) (see Fig. 3). The solid line represents the absorbance calculated from the reduced-minus-oxidized heme a and reduced-minus-oxidized CmCyt c spectra (see Eq. 2). In both A and B a positive absorbance change is defined as an increase in absorbance after the flash. Error bars (SD) are based on 1–3 measurements on three different samples at each wavelength.

