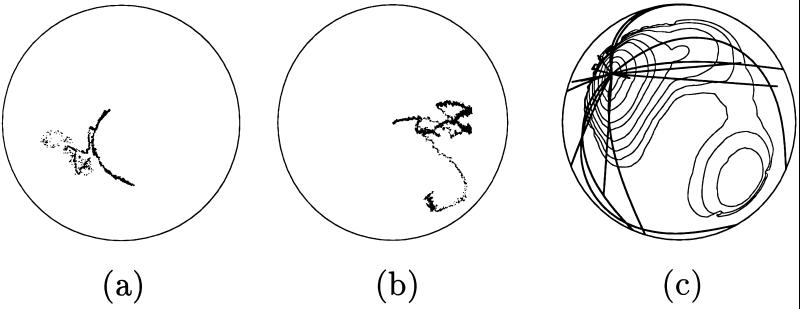
Figure 3.
Symmetry breaking in aster positioning and evolution of aster configurations. (a) Track of AMTOC position over a 63-min period in a 6-μm-deep circular chamber of radius 18 μm (10). The chamber edge is indicated by the circle. The tubulin concentration is 1.6 mg/ml. Each dot represents a single measurement, taken at 1-s intervals. During the interval shown here microtubules were polymerized. The longest arc was followed from the center toward the edge, increasing the displacement of the AMTOC from the center. (b) Track of aster position in a numerical simulation of bending and dynamic instability (24). Note the long periods of directed motion, similar to the experimental findings. (c) Contour plot of the total bending energy of the 20 microtubules in an aster as the position of the aster is varied (microtubule lengths and angles held constant). The aster is shown at the position of lowest energy.

