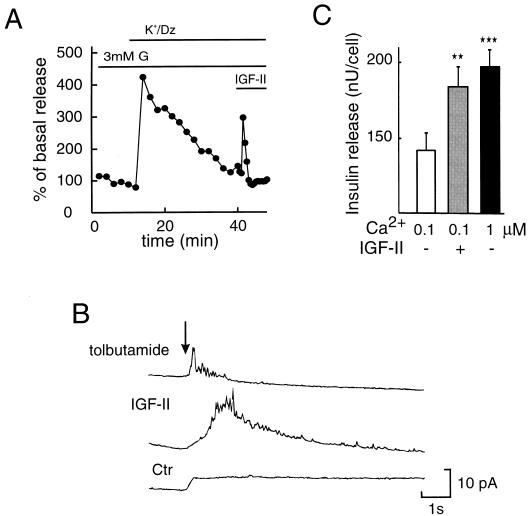
Figure 3.
Direct effect of IGF-II on insulin exocytosis. (A) β cells were perifused in the presence of 25 mM K+/100 μM diazoxide (Dz), to induce membrane depolarization and to ensure that the ATP-regulated K+ channels are kept open. IGF-II (50 ng/ml) was added 30 min after the addition of K+/diazoxide. Insulin release is expressed as the percentage of basal secretion. Representative experiments out of three are shown. (B) Comparison of amperometric current recordings in single β cells after stimulation with 200 μM tolbutamide (5 sec; top trace) and 100 ng/ml IGF-II (10 sec; middle trace). In this case, the SU tolbutamide is used as a positive control. The arrow indicates the initiation of stimulation for all recordings. The spikes elicited are of similar size and time course for the two stimulation protocols. This is expected for an exocytosis measurement because the amount released per vesicle and the amount detected in a spike will be independent of the method used to initiate exocytosis (30, 31). In both cases, the spikes are superimposed over a broad envelope, although the envelope is more obvious with IGF-II stimulation. The envelope is partially due to overlapping of many spikes occurring simultaneously (30, 31) and partially due to a background change associated with the IGF-II stimulation. The bottom trace shows the background shift induced by IGF-II addition and recorded in a β cell not responding to the agonist. A similar background shift is obtained when no cell is present (data not shown). Spikes were observed in 41% (7 out of 17) of the cells tested with IGF-II. Trains of 10 or more spikes were observed in 18% (3 out of 17) of the cells tested. The response is given in picoamperes per second. (C) Effect of IGF-II (50 ng/ml) on exocytosis of insulin in electropermeabilized β cells, incubated in the presence of ATP and an ATP regenerating system at a concentration of 10−7 M ambient free Ca2+. Results for insulin release at 10−7 M Ca2+ in the absence (□) or presence ( ) of IGF-II as well as release induced by 10−6 M Ca2+ (▪) (as control) are given as mean values ± SD (nanounits per cell) for one representative experiment in quadruples, out of four. ∗∗, P < 0.01; ∗∗∗, P < 0.001.

