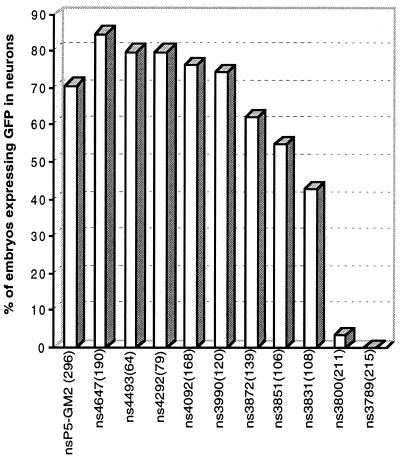
Figure 4.
Fine mapping of the neuron-specific enhancer using a deletion series generated by PCR. Data obtained for embryos injected with nsP5–GM2 was used as a control for these experiments. For each construct, the bar graph shows the percentage of microinjected embryos that expressed GFP in the CNS. The number of microinjected embryos observed for each PCR product generated is shown in parentheses.

