
Figure 4.
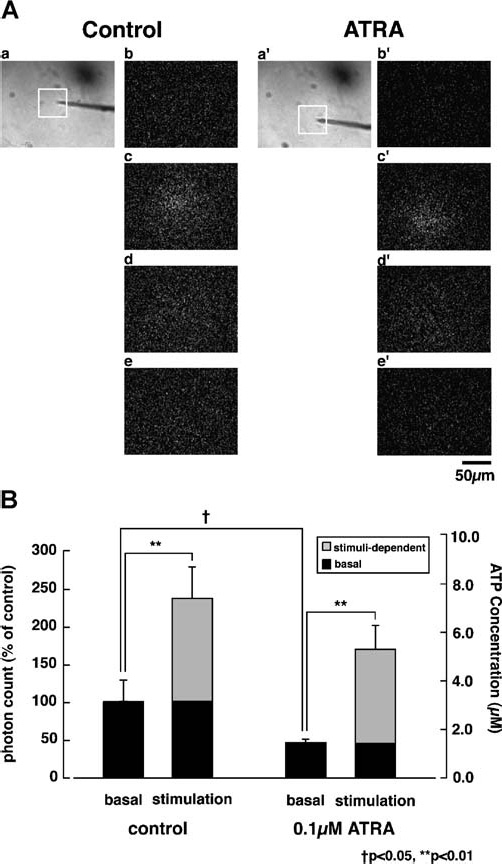
Visualization of release of ATP from NHEKs. The image panels in A show ATP-derived photons (white dots) in a field of ATRA-treated (right) and -untreated control NHEKs (left). NHEKs were incubated with 0.1 µM ATRA for 6 h. Cells were bathed in luciferin-luciferase reagent and the bioluminescence signals were obtained with a VIM camera (see Materials and methods Section) with an exposure time of 10 s. Sequential images show the ATP-derived photon-signals before (−10 s; b & b′) and 10 (c & c′), 20 (d & d′) and 30 s (e & e′) after mechanical stimulation. The positions of the pipettes are shown in phasecontrast images of NHEKs (a & a′). In B, the accumulative photon intensity in 60 s was converted to the absolute extracellular ATP concentration using a standard ATP-photon intensity relationship curve determined with an ATP standard solution (control, n = 17; ATRA-treated, n = 14). Photons within 50 mms squares around the stimulated site (shown as white squares in a & a′ panels in A) were calculated. Asterisks show significant difference from basal groups (**P < 0.01) and dagger shows significant difference from control basal groups (†P < 0.05).