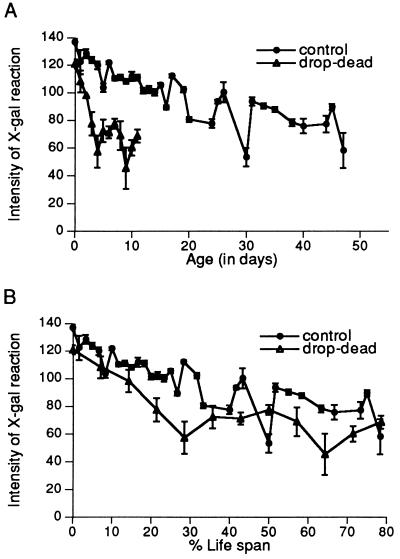
Figure 3.
Temporal patterns of expression of the en gene in the antennae of drop-dead vs. control males at 25°C. (A) Plotted against chronological age. (B) Plotted against percent life span. Each animal contained one autosomal copy of the en enhancer-trap chromosome, with or without drop-dead on the X-chromosome. (Bars = SEM.) Photographs not shown because the high level of expression in en makes it difficult to see differences in photographs that are clearly seen using the computer-assisted optical system.

