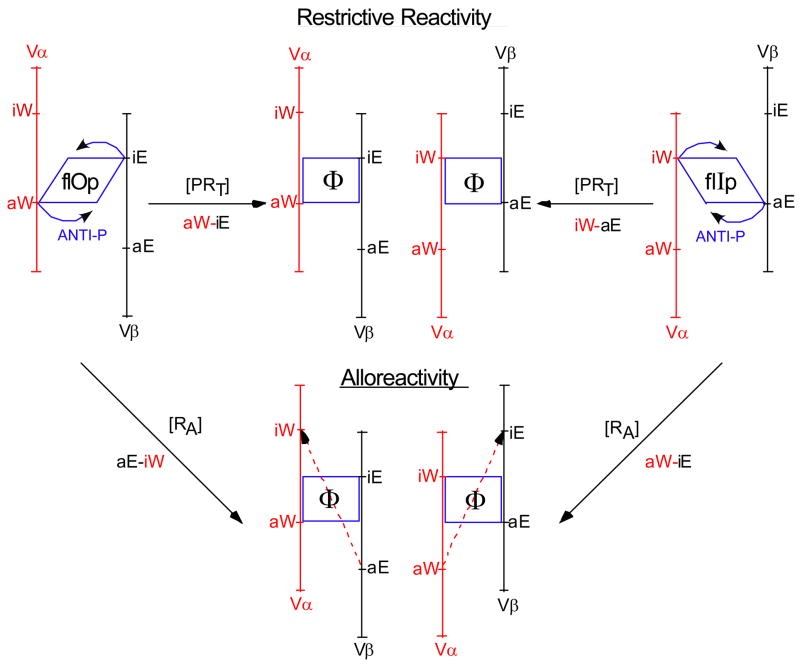
Figure 1. Schematic of the conformational changes in the TCR postulated to signal restrictive and alloreactivity.
The parallelogram to rectangle conversion represents the conformational change from flIp or flOp to Φ driven by the [P+anti-P] interaction during restrictive recognition. The two signaling orientations, aW→iE and aE→iW are represented as are the opposite orientations that drive alloreactivity, which is anti-P independent. Detailed discussion is to be found in (Cohn, 2005c).

