
Figure 3. Flt3+/ITD and Flt3ITD/ITD mice develop a chronic myeloproliferative disease with a prominent monocytic component.
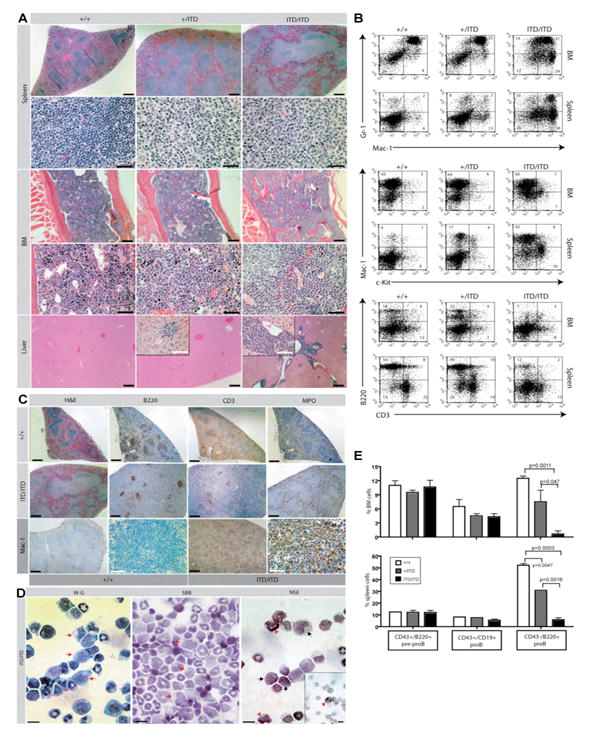
(A) Histopathologic sections of spleen, bone marrow (BM), and liver from representative Flt3+/+ (+/+), Flt3+/ITD (+/ITD), and Flt3ITD/ITD (ITD/ITD) animals in the C57BL6 background. Splenic red pulp is expanded largely by maturing myeloid and erythroid elements in both hetero- and homozygous animals which also display a prominent white pulp expansion comprised largely of intermediate sized cells with moderate amounts of pale cytoplasm (monocytes) compared to the normal small lymphocyte populations seen in wt control white pulp [spleen: first row (H&E; scale bars, 500 μm), second row (H&E; scale bars, 50 μm)]. Clusters of morphologically similar pale cells are observed in BM and liver of Flt3ITD/ITD mice in a background of significant maturing myeloid hyperplasia (also seen in heterozygous animals to a lesser degree) when compared with unremarkable BM from wt controls displaying normal maturing trilineage hematopoiesis [BM: first row (H&E; scale bars, 200 μm), second row (H&E; scale bars, 50 μm); Liver (H&E; scale bars, 200 μm; insets, 60 μm)]. (B) Flow cytometric analysis of single cell suspensions of BM and spleen of representative Flt3+/+ (+/+), Flt3+/ITD (+/ITD), and Flt3ITD/ITD (ITD/ITD) mice demonstrates a progressive increase in both mature granulocytic (Gr1+/Mac1+) and monocytic (Gr1-/lo/Mac1+) populations as well as immature myelomonocytic (Mac1+/-/ckit+) cells with a corresponding decrease in the amount of B (B220+) and T (CD3+) lymphoid cell populations. (C) Immunohistochemistry staining of paraffin-embedded spleen sections from Flt3+/+ and Flt3ITD/ITD mice for B220, CD3, and Mac1 illustrate similar reductions in the B and T lymphoid populations and an expanded Mac1 population in mutant versus wt control respectively for both Flt3+/+ and Flt3ITD/ITD mice. Scale bars; 500 μm (black); 50 μm (white). Stains for myeloperoxidase (MPO) highlight increased myeloid populations confined within splenic red pulp of homozygous mutant animals. (D) Cytospins of BM cells from Flt3ITD/ITD mice demonstrates variably weak (black arrows; third panel) to strong (red arrowheads; third panel) staining of the expanded monocyte population [first panel: red arrows, Wright-Giemsa (W-G)] for napthol AS-D chloroacetate esterase [third panel: NSE), but negative staining for sudan black B [middle panel: red arrows, SBB]. Scale bars, 20 μm. (E) Flow cytometric analysis of percentage (mean +/- S.E.M.) of pre-proB (CD43+/B220+), proB (CD43+/CD19+), and preB (CD43-/B220+) cells in BM and spleen from Flt3+/+, Flt3+/ITD and Flt3ITD/ITD mice indicates an ITD allelic dose-dependent block at the preB stage of development.