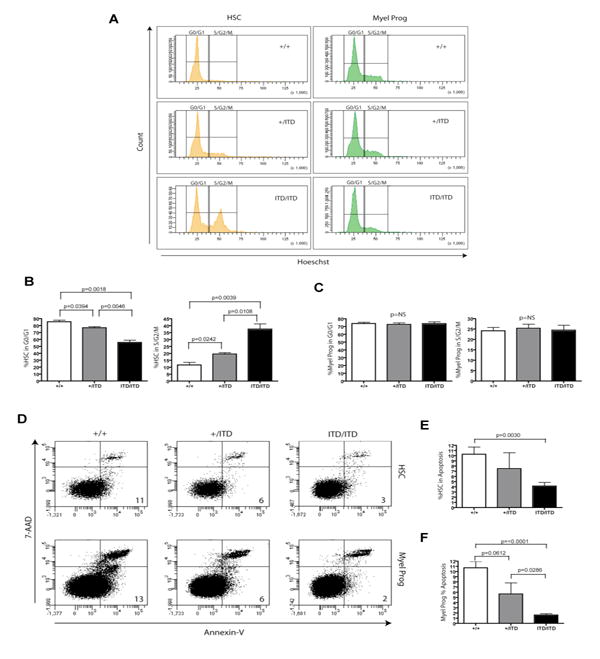
Figure 5. Effects of activated Flt3 expression on cell cycle distribution and survival within multipotent hematopoietic stem and progenitor cell compartments.

(A-C) Multiparameter flow cytometry of primitive stem and progenitor (Lin-Sca1+ckit+) and myeloid progenitor (Lin-Sca1-ckit+) populations demonstrate an LSK-specific increase of cells in S/G2/M and proportional decrease in G0/G1 in an ITD dose-dependent manner. (B-C) Representative cell cycle data from one of two independent experiments (mean +/- S.E.M.; Flt3+/+, n=3; Flt3+/ITD, n=3; Flt3ITD/ITD, n=3; differences were statistically significant in both independent experiments, student's t-test). (D-F) Survival analysis of HSC (Lin-Sca1+ckit+) and myeloid progenitor (Lin-Sca1-ckit+) cells show a dose-dependent decrease in the percentage of apoptotic cells (7-AAD-/Annexin-V+) in both compartments. (E-F) Representative apoptosis data from one of two independent experiments (mean +/- S.E.M.; Flt3+/+, n=3; Flt3+/ITD, n=3; Flt3ITD/ITD, n=3; differences were statistically significant in both independent experiments, student's t-test).
