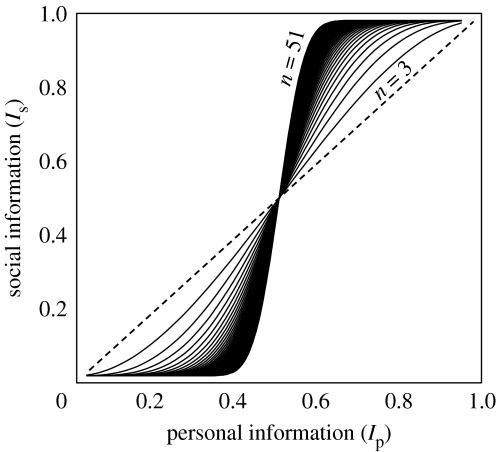
Figure 1.
Relative quality of social versus personal information. Plot of quality of social information (Is), i.e. the probability that the majority of the group is correct, against the quality of personal information (Ip), i.e. the probability that the information possessed by an individual is correct. Lines plotted are for odd group sizes (n) up to 51. To the left-hand side of the dashed line through the origin (n=1) are represented all scenarios where an individual should use social information; to the right-hand side of the line, an individual would do better to rely on its own personally acquired information.

