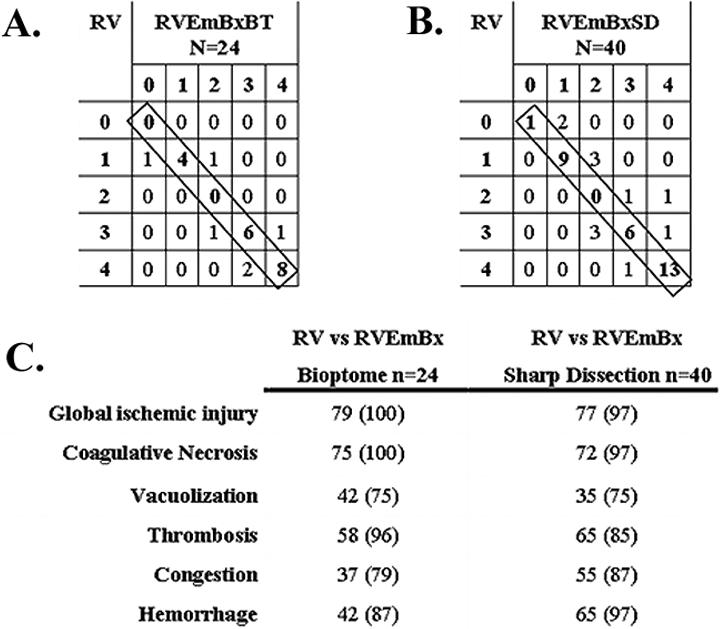
Figure 2.

A matrix analysis was used to compare histology scores for each characteristic of DXR. A. Illustrates the matrix comparison between paired samples of RV and RVEmBxBT for the degree of coagulative necrosis. Histology scores ranged form 0 – 4 as described in the Materials and methods. Numbers on the diagonal (boxed) represent samples where the biotome biopsy and RV cross section of a xenograft exhibited the same histology score B. The same analysis as in A for coagulative necrosis, now comparing RV and RVEmBxSD. C. Summarizes the analysis for each characteristic of DXR comparing RV cross sections to biotome and sharp dissection biopsies. Values indicate the percentage of rejected xenografts with identical histology scores. The number in parentheses is the percentage of sample pairs that differed by only one histology score. (p value >0.05 for all the variables examined)
