
Figure 2.
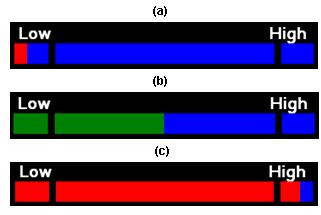
Visual Interface. Visual interface displaying horizontal bar that is proportional to level of vibrotactile feedback. A) shows bar when Low cue is reached (Level 1) successfully, B) shows bar at beginning of each trial (Level 4), and C) shows bar when High cue is reached (Level 7).