
Figure 4.
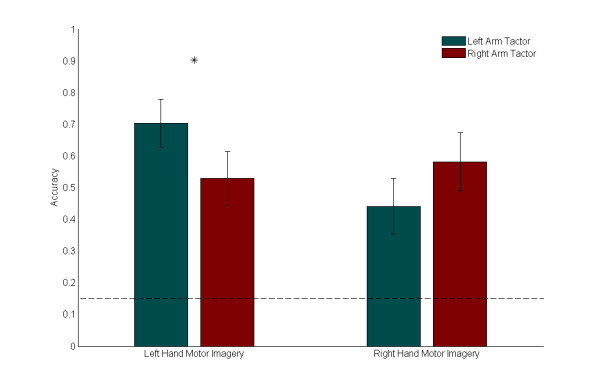
Accuracy Comparison. Means and standard errors of accuracies across all subjects, separated by motor imagery and tactor location. The dotted line indicates the success rate expected through random chance (15%). For Low cues (which required left hand motor imagery), mean accuracy was statistically significantly higher with vibratory stimulus on the left arm (p = 0.031). For High cues (which required right hand motor imagery), mean accuracy was higher with the stimulus on the right arm.